Version 1.0.0
@stackline/debug
Lightweight debugging utility for Node.js and the browser
Independent maintenance of debug 4.4.3. Original authors and licenses are retained.
Installation
# Preserve existing imports with an npm alias
npm install debug@npm:@stackline/debug@1.0.0
# Or use the scoped package name in your imports
npm install @stackline/debug@1.0.0
Node.js: >=6.0. Read the compatibility and maintenance notes before migrating.
Usage and API
The reference below may retain upstream package names. Use the alias installation above to run those imports with this Stackline release.
debug


A tiny JavaScript debugging utility modelled after Node.js core's debugging technique. Works in Node.js and web browsers.
Installation
$ npm install debug
Usage
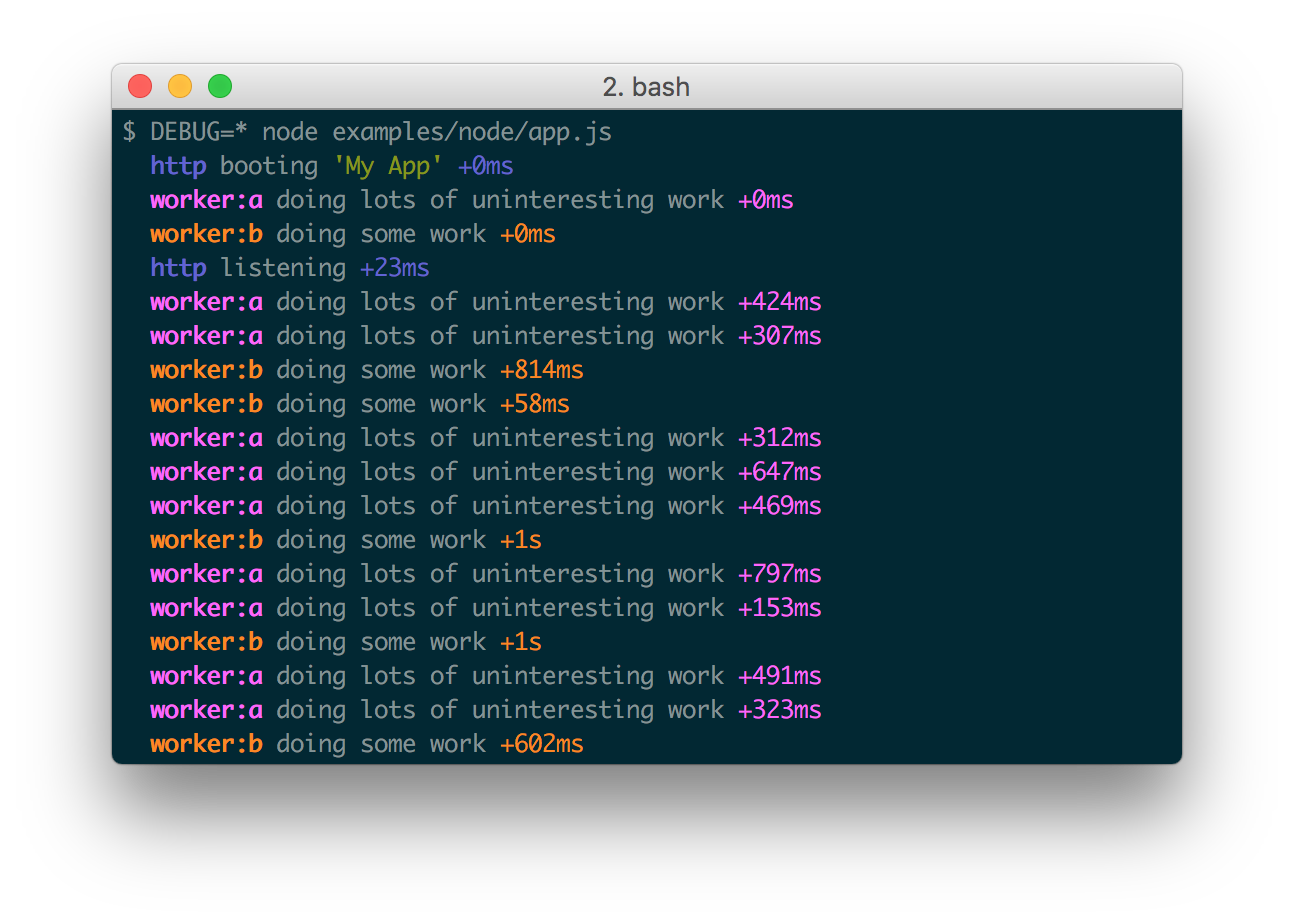
debug exposes a function; simply pass this function the name of your module, and it will return a decorated version of console.error for you to pass debug statements to. This will allow you to toggle the debug output for different parts of your module as well as the module as a whole.
Example app.js:
var debug = require('debug')('http')
  , http = require('http')
  , name = 'My App';

// fake app

debug('booting %o', name);

http.createServer(function(req, res){
  debug(req.method + ' ' + req.url);
  res.end('hello\n');
}).listen(3000, function(){
  debug('listening');
});

// fake worker of some kind

require('./worker');
Example worker.js:
var a = require('debug')('worker:a')
  , b = require('debug')('worker:b');

function work() {
  a('doing lots of uninteresting work');
  setTimeout(work, Math.random() * 1000);
}

work();

function workb() {
  b('doing some work');
  setTimeout(workb, Math.random() * 2000);
}

workb();
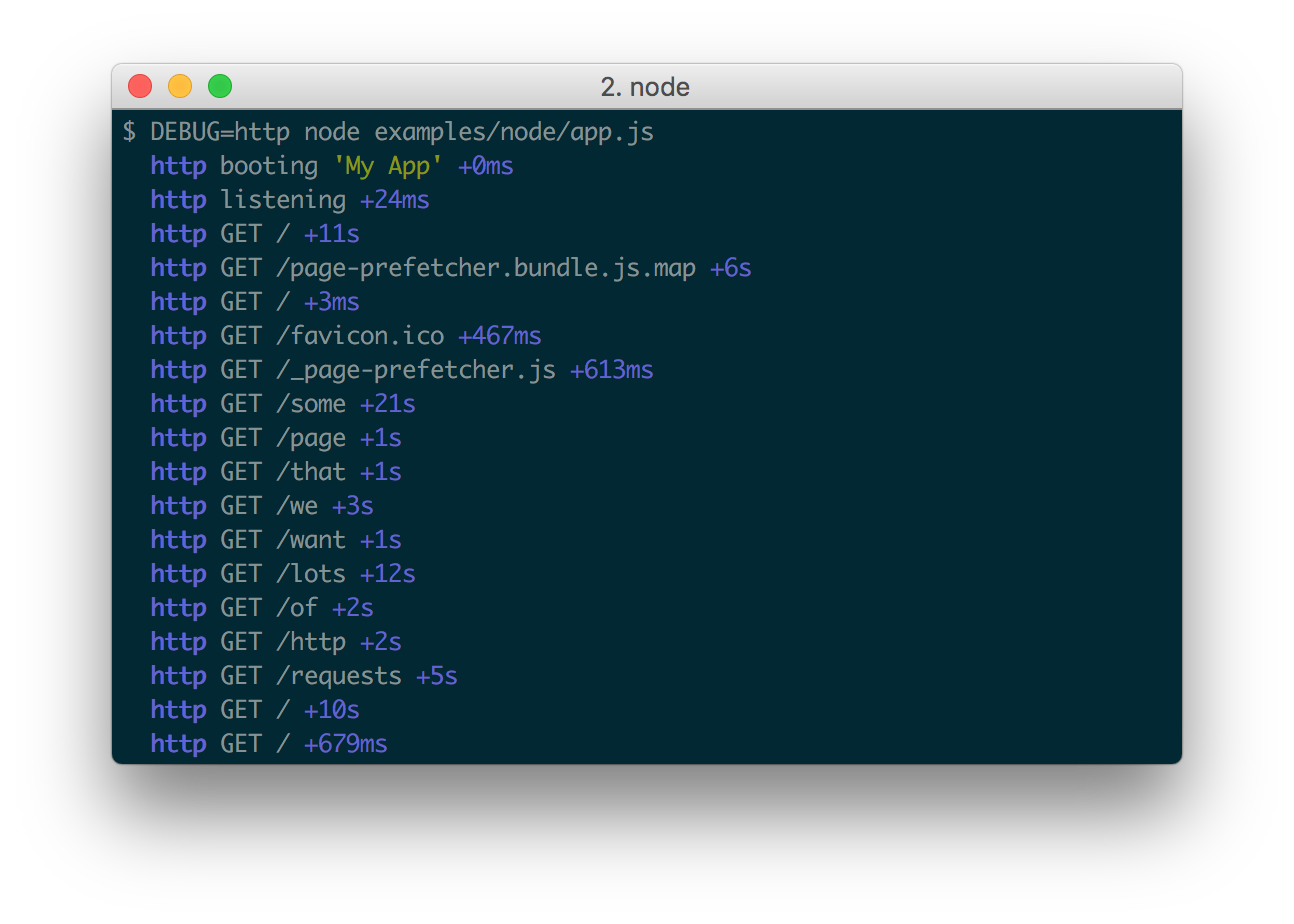
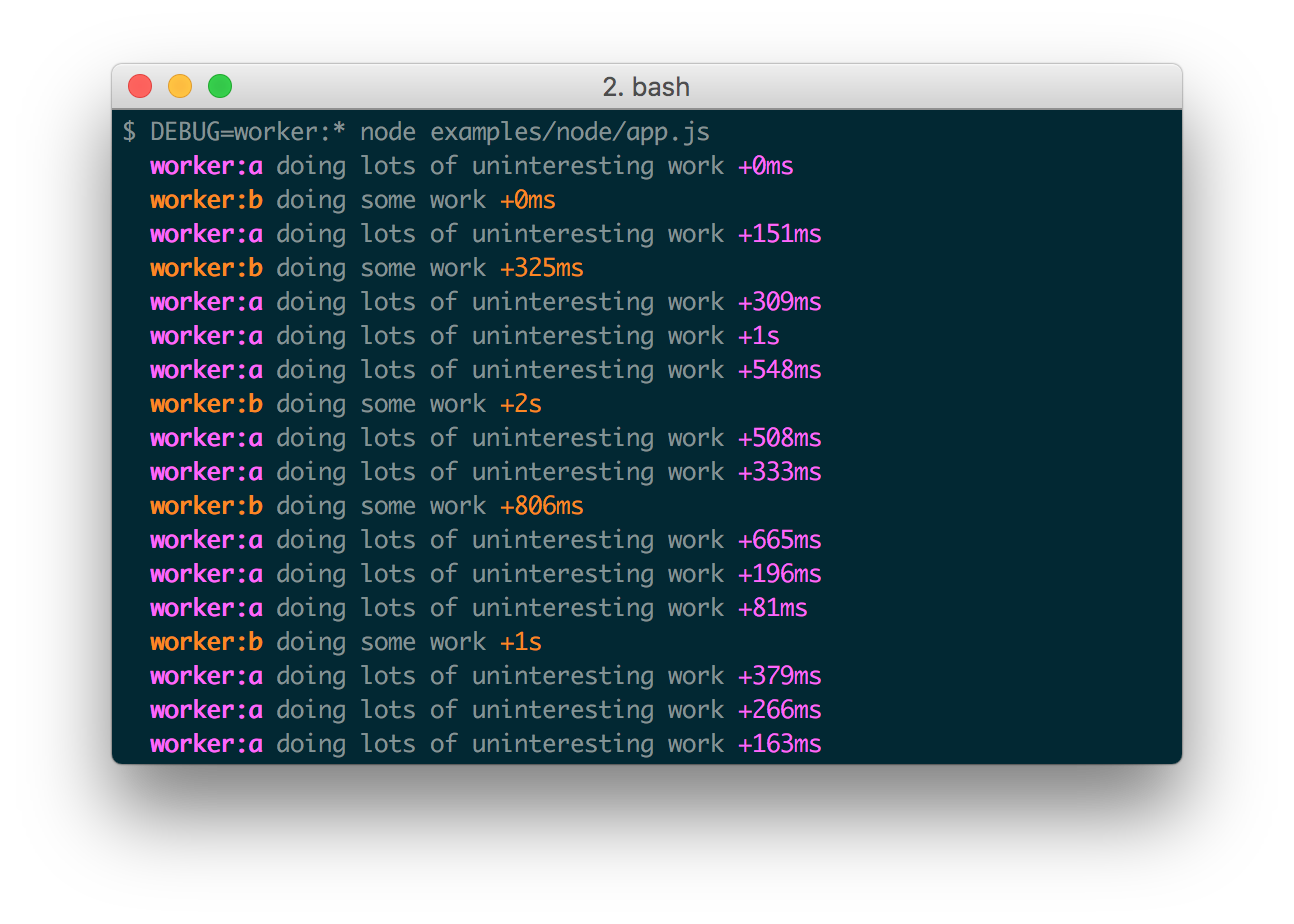
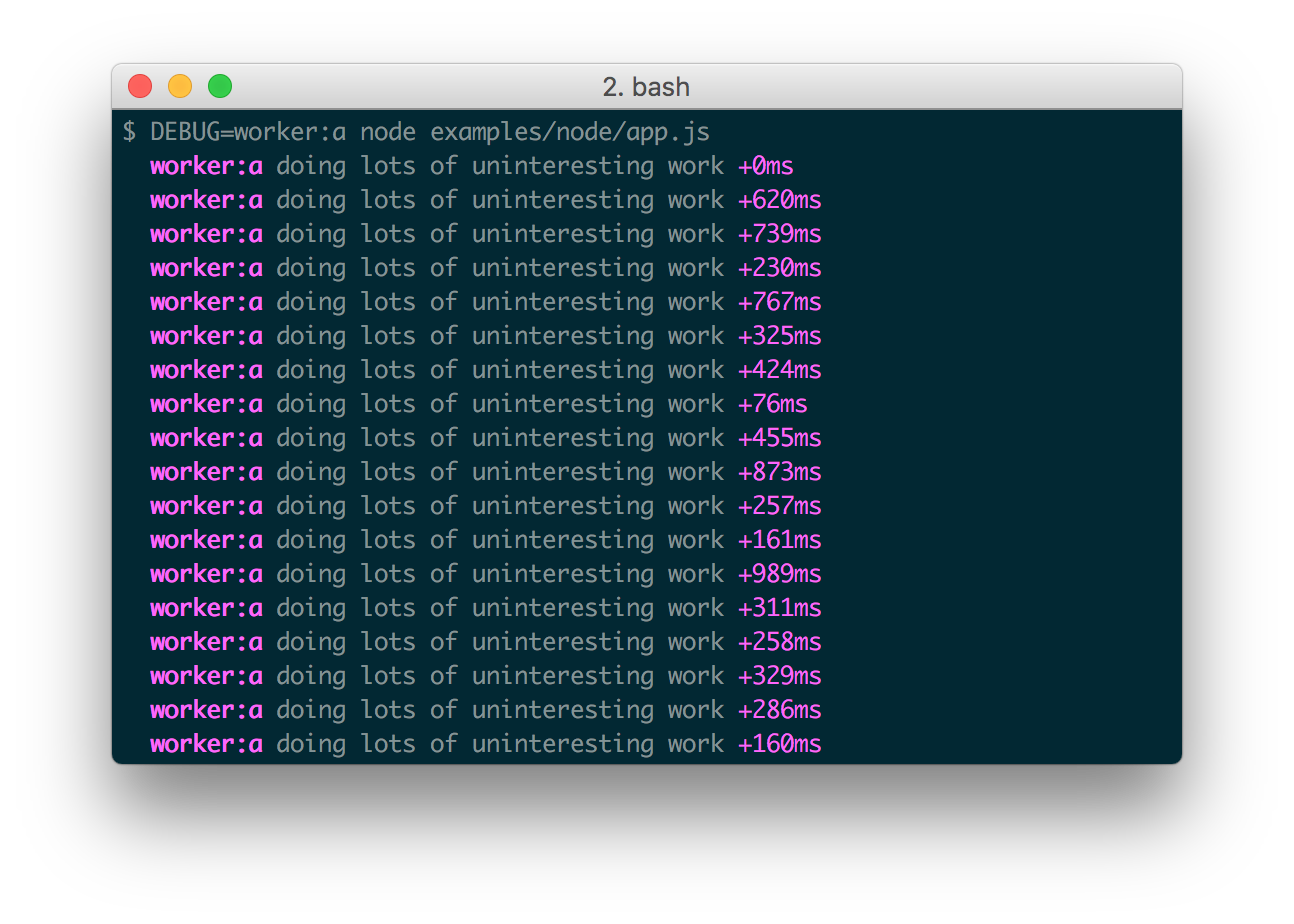
The DEBUG environment variable is then used to enable these based on space or
comma-delimited names.
Here are some examples:
Windows command prompt notes
CMD
On Windows the environment variable is set using the set command.
set DEBUG=*,-not_this
Example:
set DEBUG=* & node app.js
PowerShell (VS Code default)
PowerShell uses different syntax to set environment variables.
$env:DEBUG = "*,-not_this"
Example:
$env:DEBUG='app';node app.js
Then, run the program to be debugged as usual.
npm script example:
"windowsDebug": "@powershell -Command $env:DEBUG='*';node app.js",
Namespace Colors
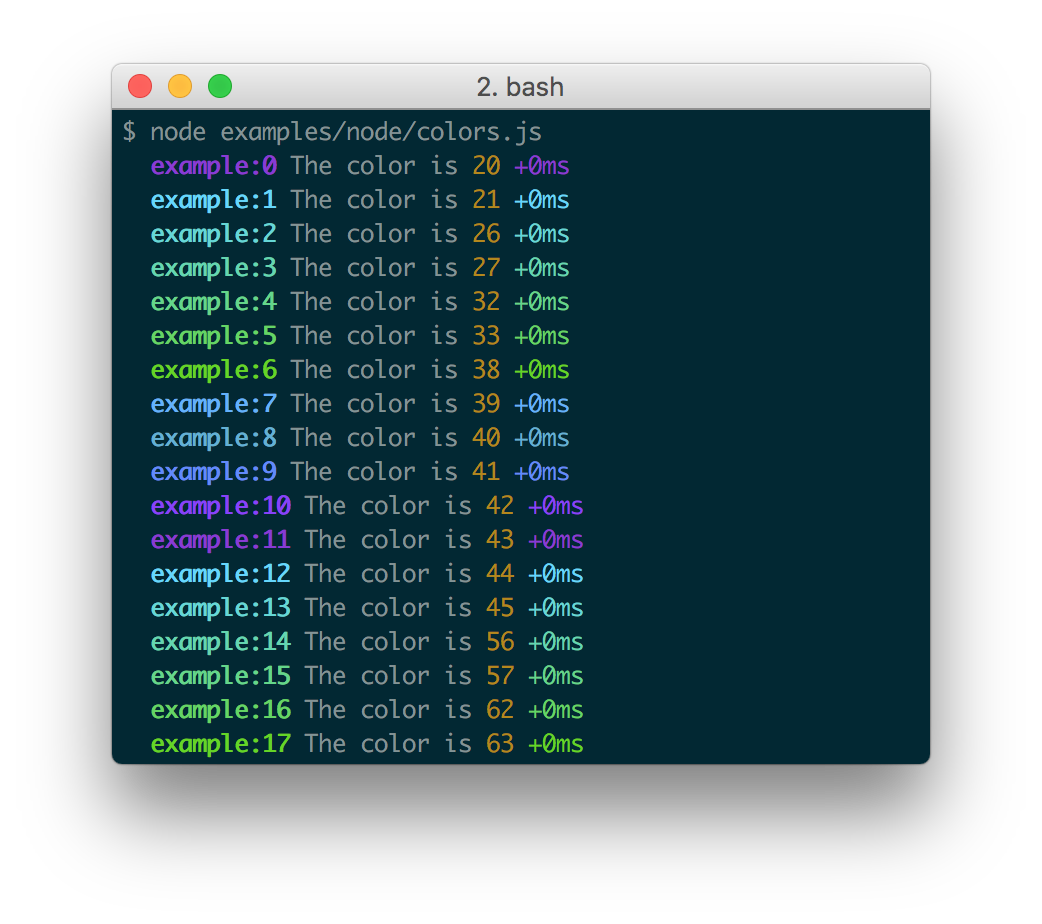
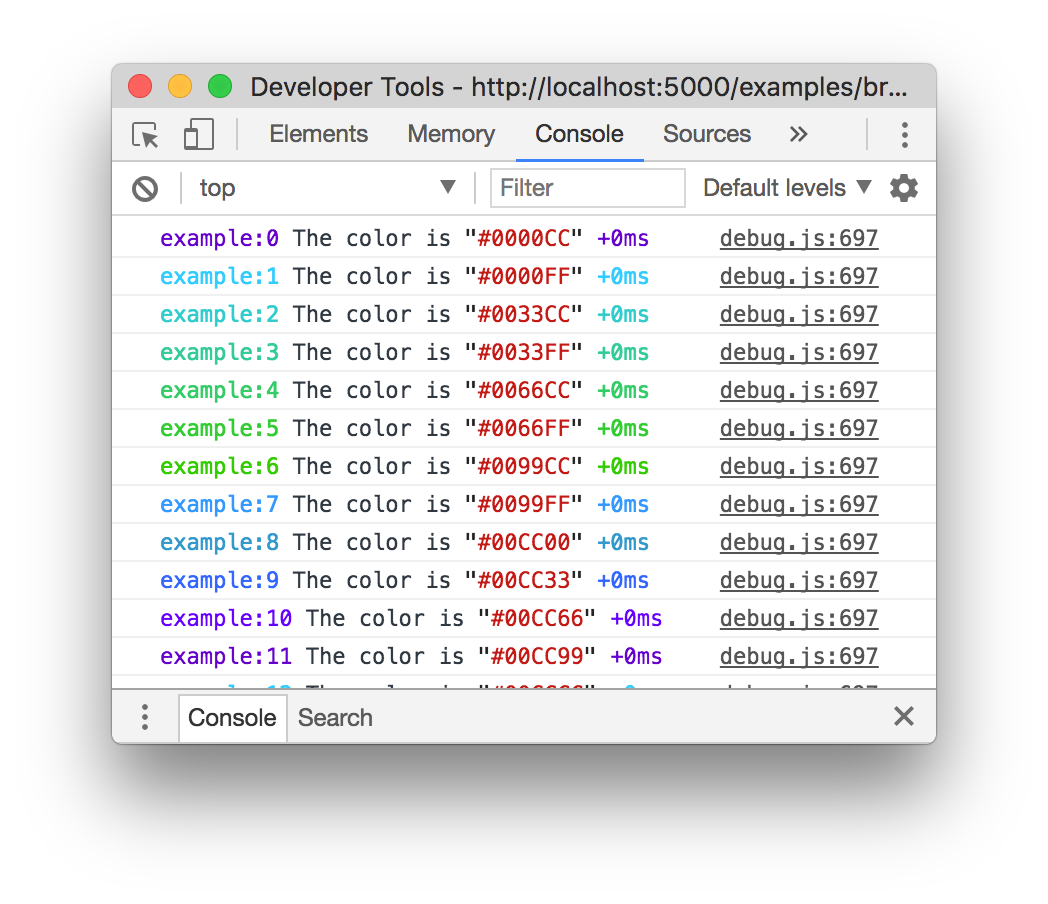
Every debug instance has a color generated for it based on its namespace name. This helps when visually parsing the debug output to identify which debug instance a debug line belongs to.
Node.js
In Node.js, colors are enabled when stderr is a TTY. You also should install
the supports-color module alongside debug,
otherwise debug will only use a small handful of basic colors.
Web Browser
Colors are also enabled on "Web Inspectors" that understand the %c formatting
option. These are WebKit web inspectors, Firefox (since version
31)
and the Firebug plugin for Firefox (any version).
Millisecond diff
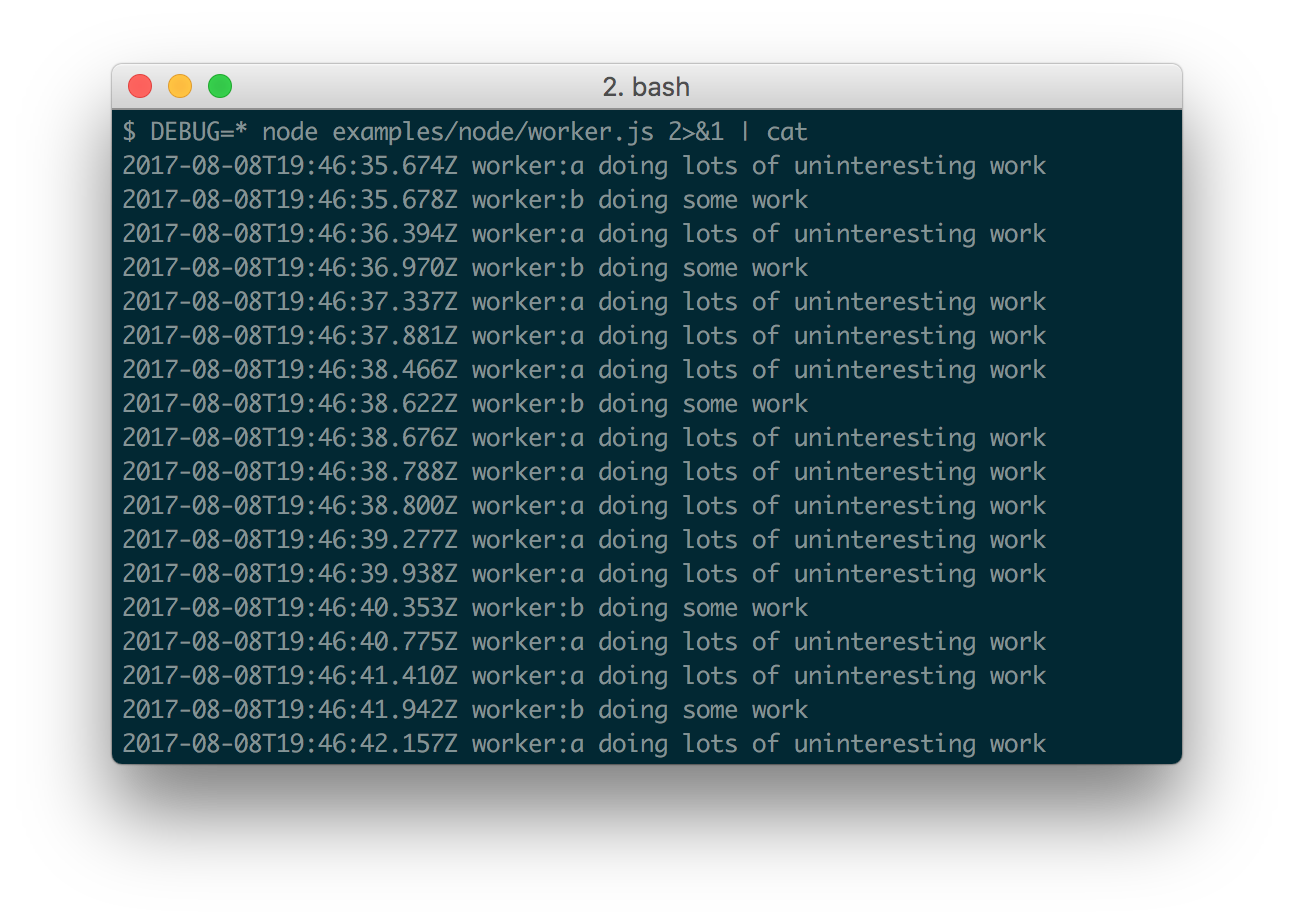
When actively developing an application it can be useful to see when the time spent between one debug() call and the next. Suppose for example you invoke debug() before requesting a resource, and after as well, the "+NNNms" will show you how much time was spent between calls.
When stdout is not a TTY, Date#toISOString() is used, making it more useful for logging the debug information as shown below:
Conventions
If you're using this in one or more of your libraries, you should use the name of your library so that developers may toggle debugging as desired without guessing names. If you have more than one debuggers you should prefix them with your library name and use ":" to separate features. For example "bodyParser" from Connect would then be "connect:bodyParser". If you append a "*" to the end of your name, it will always be enabled regardless of the setting of the DEBUG environment variable. You can then use it for normal output as well as debug output.
Wildcards
The * character may be used as a wildcard. Suppose for example your library has
debuggers named "connect:bodyParser", "connect:compress", "connect:session",
instead of listing all three with
DEBUG=connect:bodyParser,connect:compress,connect:session, you may simply do
DEBUG=connect:*, or to run everything using this module simply use DEBUG=*.
You can also exclude specific debuggers by prefixing them with a "-" character.
For example, DEBUG=*,-connect:* would include all debuggers except those
starting with "connect:".
Environment Variables
When running through Node.js, you can set a few environment variables that will change the behavior of the debug logging:
| Name | Purpose |
|---|---|
DEBUG |
Enables/disables specific debugging namespaces. |
DEBUG_HIDE_DATE |
Hide date from debug output (non-TTY). |
DEBUG_COLORS |
Whether or not to use colors in the debug output. |
DEBUG_DEPTH |
Object inspection depth. |
DEBUG_SHOW_HIDDEN |
Shows hidden properties on inspected objects. |
Note: The environment variables beginning with DEBUG_ end up being
converted into an Options object that gets used with %o/%O formatters.
See the Node.js documentation for
util.inspect()
for the complete list.
Formatters
Debug uses printf-style formatting. Below are the officially supported formatters:
| Formatter | Representation |
|---|---|
%O |
Pretty-print an Object on multiple lines. |
%o |
Pretty-print an Object all on a single line. |
%s |
String. |
%d |
Number (both integer and float). |
%j |
JSON. Replaced with the string '[Circular]' if the argument contains circular references. |
%% |
Single percent sign ('%'). This does not consume an argument. |
Custom formatters
You can add custom formatters by extending the debug.formatters object.
For example, if you wanted to add support for rendering a Buffer as hex with
%h, you could do something like:
const createDebug = require('debug')
createDebug.formatters.h = (v) => {
  return v.toString('hex')
}

// …elsewhere
const debug = createDebug('foo')
debug('this is hex: %h', new Buffer('hello world'))
//   foo this is hex: 68656c6c6f20776f726c6421 +0ms
Browser Support
You can build a browser-ready script using browserify, or just use the browserify-as-a-service build, if you don't want to build it yourself.
Debug's enable state is currently persisted by localStorage.
Consider the situation shown below where you have worker:a and worker:b,
and wish to debug both. You can enable this using localStorage.debug:
localStorage.debug = 'worker:*'
And then refresh the page.
a = debug('worker:a');
b = debug('worker:b');

setInterval(function(){
  a('doing some work');
}, 1000);

setInterval(function(){
  b('doing some work');
}, 1200);
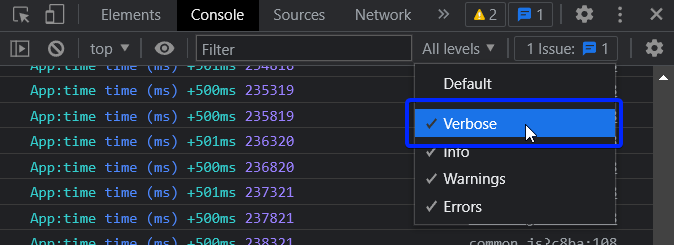
In Chromium-based web browsers (e.g. Brave, Chrome, and Electron), the JavaScript console will—by default—only show messages logged by debug if the "Verbose" log level is enabled.
Output streams
By default debug will log to stderr, however this can be configured per-namespace by overriding the log method:
Example stdout.js:
var debug = require('debug');
var error = debug('app:error');

// by default stderr is used
error('goes to stderr!');

var log = debug('app:log');
// set this namespace to log via console.log
log.log = console.log.bind(console); // don't forget to bind to console!
log('goes to stdout');
error('still goes to stderr!');

// set all output to go via console.info
// overrides all per-namespace log settings
debug.log = console.info.bind(console);
error('now goes to stdout via console.info');
log('still goes to stdout, but via console.info now');
Extend
You can simply extend debugger
const log = require('debug')('auth');

//creates new debug instance with extended namespace
const logSign = log.extend('sign');
const logLogin = log.extend('login');

log('hello'); // auth hello
logSign('hello'); //auth:sign hello
logLogin('hello'); //auth:login hello
Set dynamically
You can also enable debug dynamically by calling the enable() method :
let debug = require('debug');

console.log(1, debug.enabled('test'));

debug.enable('test');
console.log(2, debug.enabled('test'));

debug.disable();
console.log(3, debug.enabled('test'));
print :
1 false
2 true
3 false
Usage :enable(namespaces)namespaces can include modes separated by a colon and wildcards.
Note that calling enable() completely overrides previously set DEBUG variable :
$ DEBUG=foo node -e 'var dbg = require("debug"); dbg.enable("bar"); console.log(dbg.enabled("foo"))'
=> false
disable()
Will disable all namespaces. The functions returns the namespaces currently enabled (and skipped). This can be useful if you want to disable debugging temporarily without knowing what was enabled to begin with.
For example:
let debug = require('debug');
debug.enable('foo:*,-foo:bar');
let namespaces = debug.disable();
debug.enable(namespaces);
Note: There is no guarantee that the string will be identical to the initial enable string, but semantically they will be identical.
Checking whether a debug target is enabled
After you've created a debug instance, you can determine whether or not it is
enabled by checking the enabled property:
const debug = require('debug')('http');

if (debug.enabled) {
  // do stuff...
}
You can also manually toggle this property to force the debug instance to be enabled or disabled.
Usage in child processes
Due to the way debug detects if the output is a TTY or not, colors are not shown in child processes when stderr is piped. A solution is to pass the DEBUG_COLORS=1 environment variable to the child process.
For example:
worker = fork(WORKER_WRAP_PATH, [workerPath], {
  stdio: [
    /* stdin: */ 0,
    /* stdout: */ 'pipe',
    /* stderr: */ 'pipe',
    'ipc',
  ],
  env: Object.assign({}, process.env, {
    DEBUG_COLORS: 1 // without this settings, colors won't be shown
  }),
});

worker.stderr.pipe(process.stderr, { end: false });
Authors
- TJ Holowaychuk
- Nathan Rajlich
- Andrew Rhyne
- Josh Junon
Backers
Support us with a monthly donation and help us continue our activities. [Become a backer]





Sponsors
Become a sponsor and get your logo on our README on Github with a link to your site. [Become a sponsor]









License
(The MIT License)
Copyright (c) 2014-2017 TJ Holowaychuk <tj@vision-media.ca> Copyright (c) 2018-2021 Josh Junon
Permission is hereby granted, free of charge, to any person obtaining a copy of this software and associated documentation files (the 'Software'), to deal in the Software without restriction, including without limitation the rights to use, copy, modify, merge, publish, distribute, sublicense, and/or sell copies of the Software, and to permit persons to whom the Software is furnished to do so, subject to the following conditions:
The above copyright notice and this permission notice shall be included in all copies or substantial portions of the Software.
THE SOFTWARE IS PROVIDED 'AS IS', WITHOUT WARRANTY OF ANY KIND, EXPRESS OR IMPLIED, INCLUDING BUT NOT LIMITED TO THE WARRANTIES OF MERCHANTABILITY, FITNESS FOR A PARTICULAR PURPOSE AND NONINFRINGEMENT. IN NO EVENT SHALL THE AUTHORS OR COPYRIGHT HOLDERS BE LIABLE FOR ANY CLAIM, DAMAGES OR OTHER LIABILITY, WHETHER IN AN ACTION OF CONTRACT, TORT OR OTHERWISE, ARISING FROM, OUT OF OR IN CONNECTION WITH THE SOFTWARE OR THE USE OR OTHER DEALINGS IN THE SOFTWARE.
Upstream issues and maintenance review
Upstream origin and triage
- Original package:
debug@4.4.3 - Repository: https://github.com/debug-js/debug
- Source commit: https://github.com/debug-js/debug/commit/6b2c5fbdb7d414483d9e306ef234acb4cd7ea67c
- Source directory:
. - npm tarball: https://registry.npmjs.org/debug/-/debug-4.4.3.tgz
- SHA512 integrity:
sha512-RGwwWnwQvkVfavKVt22FGLw+xYSdzARwm0ru6DhTVA3umU5hZc28V3kO4stgYryrTlLpuvgI9GiijltAjNbcqA== - npm last-release age selects maintenance scope; it does not imply no ongoing source development.
Reviewed issues
Primary-source snapshot: 2026-09-29T00:21:48.384941+00:00. Most recently updated 100 open and 30 closed issue/PR entries; PRs removed. This is triage evidence, not a claim of exhaustive review.
Maintenance adoption with preserved runtime payload. No runtime defect correction is claimed. Reports remain visible for subsequent targeted reproduction.
- 1019: Add documentation around using ESM imports
- 940: [Question] How do I enable millisecond diff?
- 989: env variable DEBUG is not parsed correctly
- 425:
debug.enable()flushes enabled namespaces - 948: Specify namespace with url in ESM
- 986: Ability to control other options programatically
- 1010: propose for npm trusted publishing with OIDC
- 1008: Debug as JSON
- 999:
.extendis undefined in cloudflare workers - 786: Use ESModules instead of module.exports
- 1002: console.group and groupCollapsed
- 981: Problem when using a library that uses
debugin Deno - 685: Does debug support React Native remote debugging.
- 758: Add unique ID without impacting wildcard functionality
- 952: Debug mixed with console.log
- 962: update colors for darkmode in devtools
- 976: Way to disable printf-style feature temporarily
- 958: Display full error object all the time regardless of argument position
- 974: Why cache namespaces?
- 959: DEBUG_HIDE_DATE doesn't exist / do anything
- 556: [RFC] Pluggable log handler
- 967: Unused format specifiers are not escaped.
- 964: Allow choice between STDERR and STDOUT
- 954: Avoid throwing errors
- 656: 5.x Roadmap
- 945: Redirect logs to file doesnt capture time
- 947: Specify peer dependency version
- 946: Different formatting for namespaces on TTY and files
- 582: Customizing output format
- 920: Support for console.table like output
- 932: Wildcard question: allow one excluding rest
- 916: Doc suggestion: Using
debugin WebWorkers / SharedWorkers - 922: Allow forcing the use of colors
- 918: namespaces returned by debug.disable are not always accepted by debug.enable
- 914: Reroute logging of an npm package that uses debug to a different logging function
- 913: Float's are truncated
- 901: Does 'debug' cache the DEBUG environment variable somewhere? Getting no output after changing namespace and DEBUG env var.
- 912: require('supports-color') will always fail, supports-color version 9+ for node
- 893: Possibility to read in config at debug instance creation instead of at first (version) require/ import?
- 483: debug with chrome dev tool issue
- 649: Clean up README
- 687: when %j exists in a formatted object, it pulls in the timestamp/delta
- 688: Thoughts on locking version of "ms" dependency?
- 751: MS Edge, almost working colors
- 766: % symbol in object interpreted as formatter
- 873: Can't set global
log()function overriding namespaces ones - 886: Override
log()functions with global ones - 641: Visual Studio Code express app
- 845: Undocumented
delete process.env.DEBUGwhen variable is empty - 744: Using debug with
esmrenders wrong formatted output for %o / %O - 698: How can I write to file without colors and to console with colors?
- 644: [RFC] Compatibility layer
- 696: Not printing any debug statements
- 743: Cannot turn on debug within a sourceless page
- 742: colors not detected in AudioWorkletProcessor
- 702: WebStorm console, Windows Command Prompt do not support 256 colors
- 669: Add Typescript types
- 711: Extending error object in express, but Debug does only show the stack trace
- 642: Object colors with a plurality of parameters
- 636: Wildcard in name doesn't auto enable on web
The structured snapshot in .stackline/issue-triage.json also records recently closed reports. Issues for unrelated packages in shared monorepositories were qualified as outside this fork’s runtime scope. No maintainer was contacted.
Release files and references
Package bytes, npm provenance and the immutable GitHub release were verified for this version. Security checks describe the reviewed release; documented compatibility risks and upstream reports are not blanket claims of resolution.